
[ad_1]
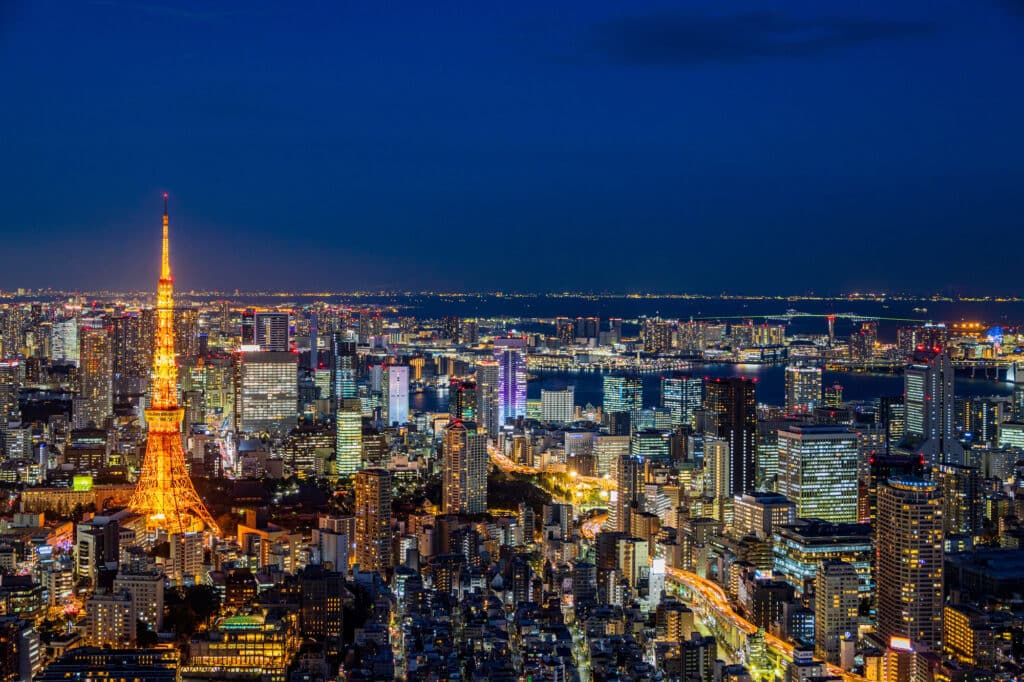
Tokyo is consistently counted among the world’s great cities, and it’s not hard to see why. As the center of the world’s most populated metropolitan area, it’s also home to the world’s best mass transit, innumerable fantastic restaurants, is (relatively) safe, and housing and general goods are (comparatively) affordable. All this exists within a capital city that’s the beating heart of Japanese economic, political, and cultural potency. So, it may come as little surprise that Tokyo has ranked in 3rd place for the eighth consecutive year in the annual Global Power City Index (GPCI) report. The Japanese capital trailed behind top runners London and New York while remaining above Paris by a narrow margin.
The report by Mori Memorial Foundation’s Institute for Urban Strategies, a think tank of the Japanese urban developer Mori Building Co., went public last month. On November 9th, the institute released its 16th GPCI report that ranks forty-eight major worldwide cities by calculating points in seventy indicators representing six urban functions.
So, what other cities managed to make their way onto the list, and what led Tokyo to rank so high yet again? Let’s take a look.

Comprehensive rankings and points (with 2600 pt. being the highest possible score)
1. London 1646.7
2. New York 1506.4
3. Tokyo 1375.8
Advertisements


4. Paris 1363.7
5. Singapore 1264.7
6. Amsterdam 1246.3
7. Seoul 1202.1
8. Dubai 1162.7
9. Melbourne 1155.4
10. Berlin 1151.7
Six functions
The Global Power City Index uses six functions to calculate its rankings: Economy; Research and Development; Cultural Interaction; Livability; Environment, and; Accessibility.
The report is available online in both English and Japanese. Here is a breakdown of how Tokyo faired in each function.
Economy (max 600 pt.)
1. New York 371.1
2. London 336.2
3. Beijing 309.4
4. Singapore 308.3
5. Zurich 302.7
…
10. Tokyo 270.1
This is Tokyo’s worst “economy” rating. It dropped from 5th last place to 10th place this year.
This was due to comparatively low points in indicators: GDP growth rate [0.3 pts.], stock market capitalization [13.4 pts.], corporate tax rate [16.8 pts.], wage level [39.0 pts.], and variety of workplace options [46.3 pts.].
All these saw Tokyo’s GDP growth sink to second worst of all forty-eight cities, despite ranking second-to-best for two indicators: nominal GDP [90.6 pts.] and world’s top 500 companies [35.4 pts.].
R&D (max 300 pt.)
1. New York 206.5
2. London 181.4
3. Los Angeles 154.9
4. Tokyo 143.4
5. Boston 137.7
Tokyo scores perfectly in the indicator for the number of patents [100.0 pts.].
However, the Japanese capital still lags behind New York and London due to scoring low in two specific indicators: number of international students [6.2 pts.] and number of startups [18.4 pts.].
“It is essential (for Tokyo) to provide assistance to startups and to develop and attract personnel,” an institute official said.
Cultural Interaction (max 500 pt.)
1. London 367.8
2. New York 259.4
3. Paris 250.7
4. Dubai 237.5
5. Tokyo 237.5
This may perhaps appear as a more difficult function to measure, but the Institute for Urban Strategies collates 16 indicators in its attempt to track “cultural interaction.” These include such data sets as “number of foreign residents,” “art market environment,” “cultural content export market,” and more.
(In case you’re wondering how Tokyo ranks in terms of livability for foreign residents amongst Japanese cities, we happen to have our own take on that subject.)
In the Global Power City Index, Tokyo scored perfectly in four indicator sets: number of cultural events [100 pts.], number of hotel rooms [100 pts.], attractiveness of shopping options [100 pts.], and attractiveness of dining options [100 pts.].
The indicators it scored lowest in were the art market environment [10.5 pts.] and cultural content export value [12.7 pts.].
Surprisingly, Tokyo ranked as low as 30th for nightlife options [35.2 pts.].
Its scores for tourist attractions [50.3 pts.] and number of luxury hotel rooms [17.3 pts.] were also unexpectedly low.

Livability (max 500 pt.)
1. Paris 390.0
2. Madrid 380.9
3. Tokyo 367.7
4. Barcelona 365.6
5. Vienna 360.0
In 3rd place, this is Tokyo’s highest ranking across all functions. This is largely to do with the city’s low unemployment rate, safety, and longevity.
Tokyo earned remarkably high points for indicators: total unemployment rate [93.8 pts.], number of murders [98.7 pts.], economic risk of natural disaster [90.9 pts.], and life expectancy [94.1 pts.].
The indicator that Tokyo scored the lowest in the “livability” function was workstyle flexibility [54.8 pts.].
Environment (max 300 pt.)
1. Stockholm 228.7
2. Copenhagen 224.2
3. Geneva 217.6
4. Helsinki 210.7
5. Vienna 210.5
…
16. Tokyo 173.8
This is Tokyo’s worst-performing function. And the indicator it scores the lowest in is its renewable energy rate [14.1 pts.].
Meanwhile, individuals in Tokyo seem to leave a smaller carbon footprint, as its score for the indicator CO 2 emissions per capita [93.5 pts.] is notably high.
Accessibility (max 400 pt.)
1. Amsterdam 229.2
2. Frankfurt 217.6
3. New York 216.1
4. London 215.9
5. Paris 210.4
…
8. Tokyo 183.3
Tokyo scored perfectly for the indicator for public transportation use [100 pts.] and had the 5th highest points for station density [49.3 pts.].
What kept Tokyo out of the top five was likely its lower scores for the indicator cities with direct international flights [25.0 pts.].
So, the ranking seems to imply some high highs for Tokyo, but also some major areas that could use improvement. Nonetheless, it continues to occupy a prestigious place in the international mindset – and in hard data sets, too.
What to Read Next:
Sources
[1] 「都市総合力ランキング」東京は世界3位 スタートアップ育成に課題. 朝日新聞
[2] 世界の都市総合力ランク、東京が8年連続の3位…大阪37位・福岡42位. 讀賣新聞
[3] 世界の都市総合力ランキング(GPCI). JIJI.com
[ad_2]
Source link